<img height="1" width="1" style="display:none;" alt="" src="https://px.ads.linkedin.com/collect/?pid=4496002&amp;fmt=gif">
image-10-1024x581

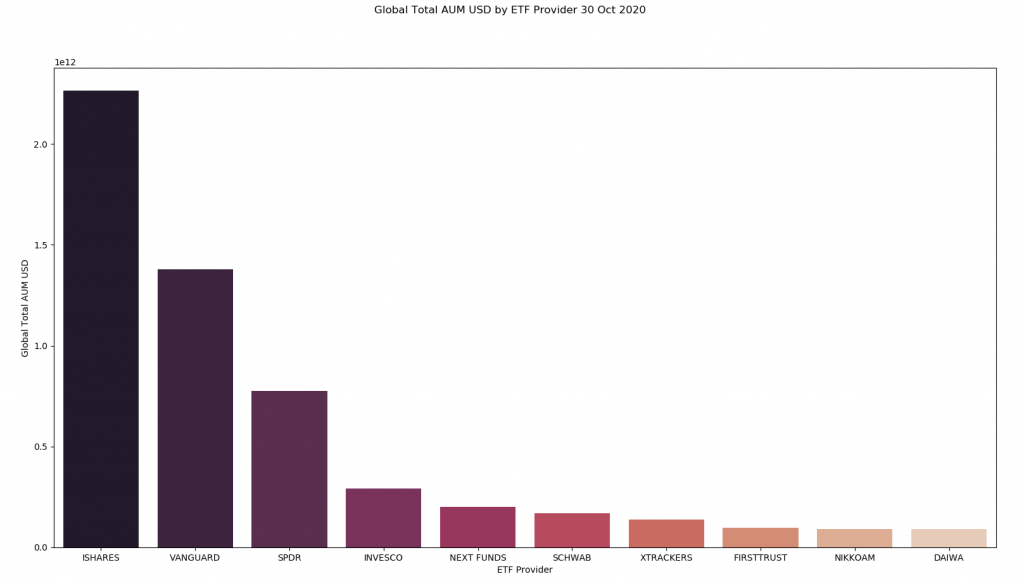
Total Global AUM – by provider.

  • ( USD in Trillions)

Total Global AUM by Region – logarithmic scale.

We have made this a log scale such that equities does not cause the other products to be too small to read on the graph.
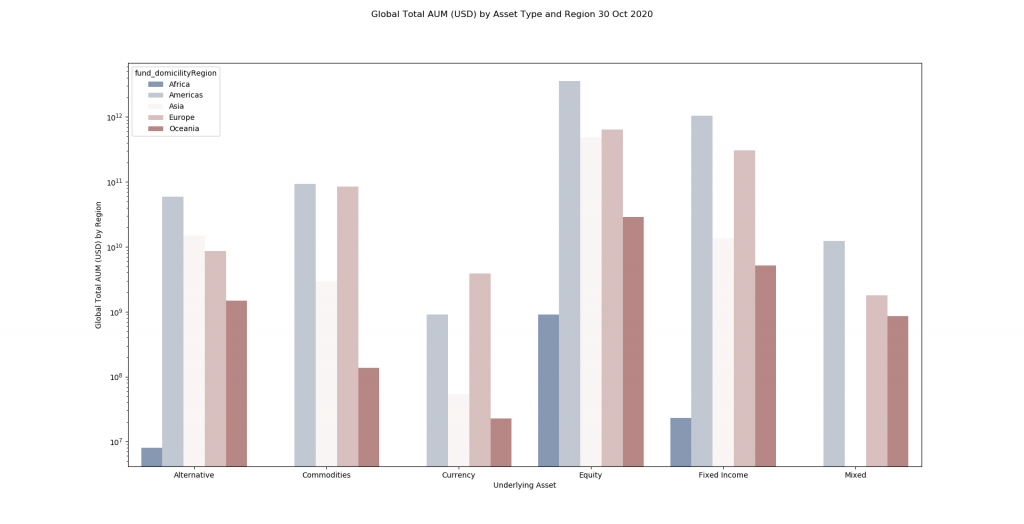
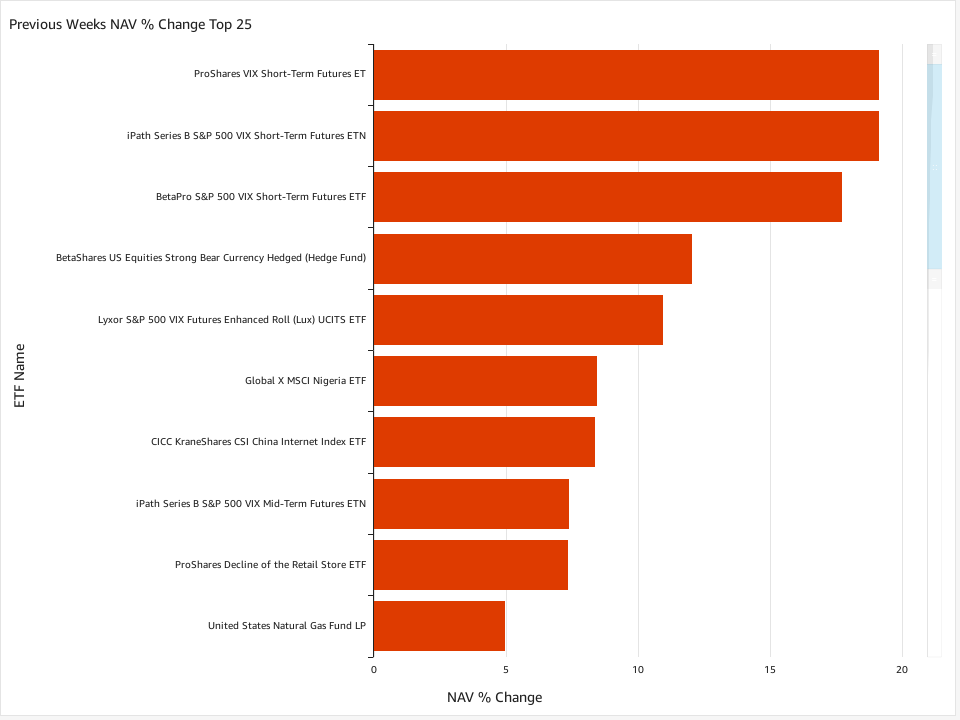
fig1_Global-Total-AUM-USD-by-Asset-Type-and-Region-30-Oct-2020-1024x524
4fadff92-c615-4b6f-9d16-440d58b8bdd0_1_DESKTOP

Largest NAV Change % in previous week.

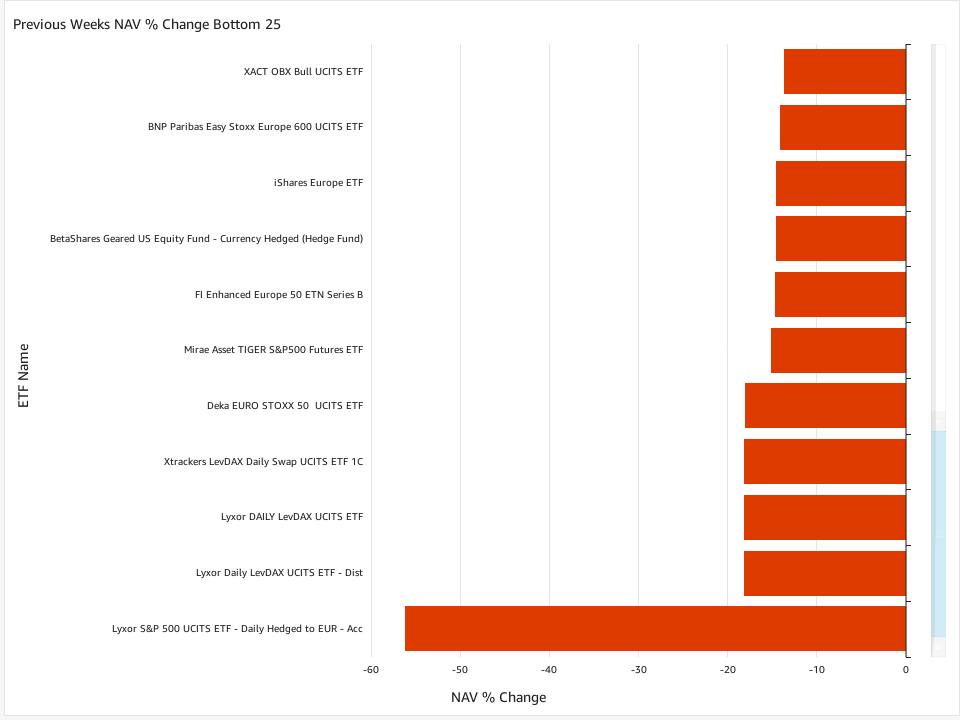
Largest NAV % decrease in previous week.
4fadff92-c615-4b6f-9d16-440d58b8bdd0_12_DESKTOP-1
4fadff92-c615-4b6f-9d16-440d58b8bdd0_5_DESKTOP

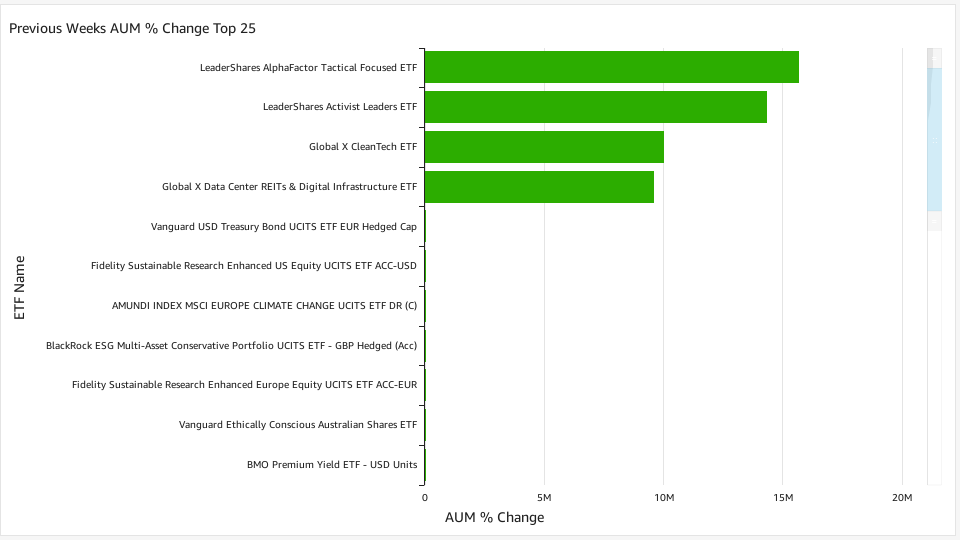
Largest AUM % Change Previous Week.

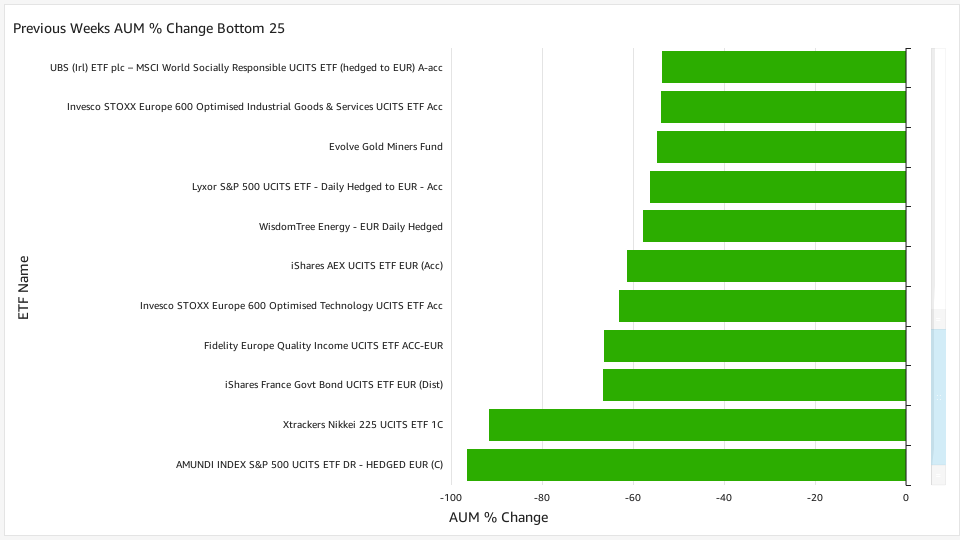
Largest AUM % Decrease Previous Week.
4fadff92-c615-4b6f-9d16-440d58b8bdd0_6_DESKTOP
4fadff92-c615-4b6f-9d16-440d58b8bdd0_4_DESKTOP

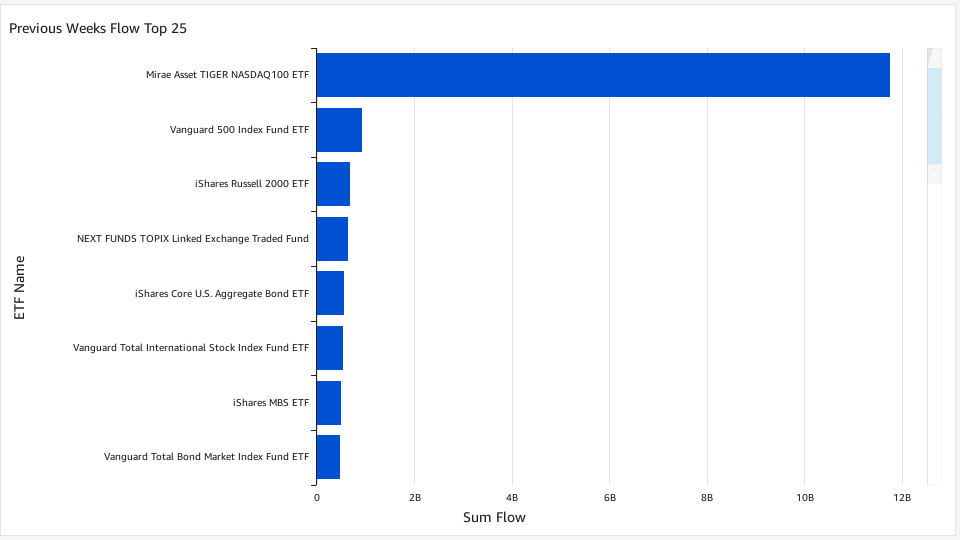
Largest Inflow Previous Week.

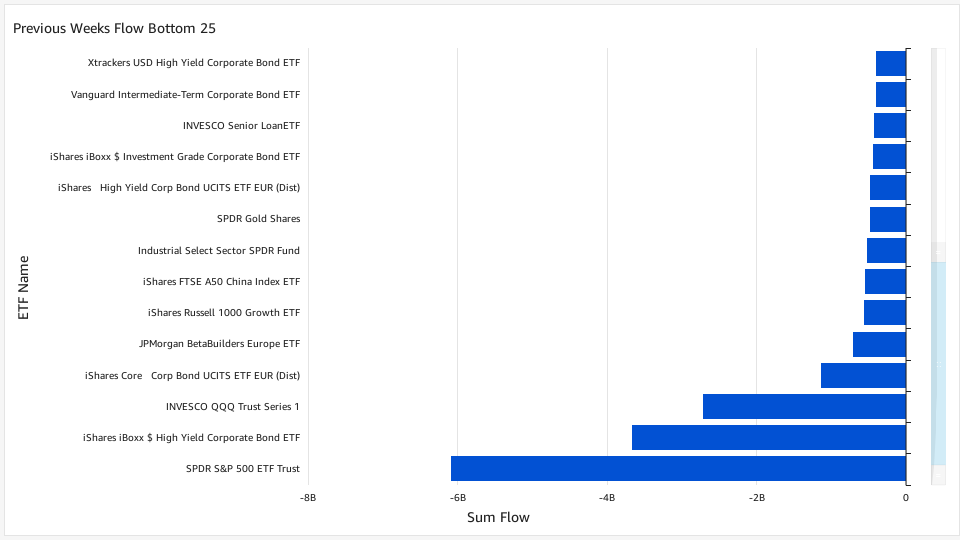
Largest AUM Outflow Previous Week.
4fadff92-c615-4b6f-9d16-440d58b8bdd0_8_DESKTOP

Want news like this in your inbox?

Sign up to our newsletter.

Man in front of laptop computer with headset

News & Insights

SPY_SPDR_ETF_png

What Is Spy?

SP-500-index-data-scaled

What is the S&P 500?

Ultumus_Thumbnail_What-is-the-FTSE-100_Green_V001

What is the FTSE 100?